DigitalOcean Referral Badge
Udit Vashisht
Author: Udit Vashisht


Matplotlib Stack Plots/Bars | Matplotlib Tutorial in Python | Chapter 4

  • 3 minutes read
  • 729 Views
Matplotlib Stack Plots/Bars | Matplotlib Tutorial in Python | Chapter 4

    Table of Contents

Matplotlib Tutorial in Python

*Matplotlib Stack Plots/Bars | Chapter 4

In this chapter we will learn to create Matplotlib/Python Stack Plots/Bars.Stack Plots are also called area graphs/plots in general.

Matplotlib Tutorials in Python - Creating a Simple Stack Plot in Matplotlib

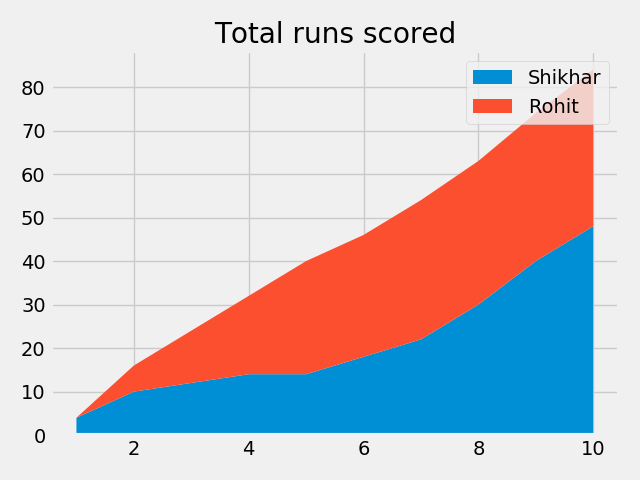
A good example of using a stack plot, will be to plot the runs scored by both the batsmen ath the end of each over of a match in Cricket. We will use plt.stackplot() to draw the plot of the runs scored by each batsman.

# matplotlib_stack_bar.py

import matplotlib.pyplot as plt

plt.style.use('fivethirtyeight')

overs = [1, 2, 3, 4, 5, 6, 7, 8, 9, 10]

batsman1 = [4, 10, 12, 14, 14, 18, 22, 30, 40, 48]

batsman2 = [0, 6, 12, 18, 26, 28, 32, 33, 34, 36]

plt.stackplot(overs, batsman1, batsman2)

plt.title('Total runs scored')
plt.tight_layout()
plt.show()

matplotlib_tutorial_stackplot.png

Matplotlib Tutorials in Python - Customizing the Stack Plot in Matplotlib

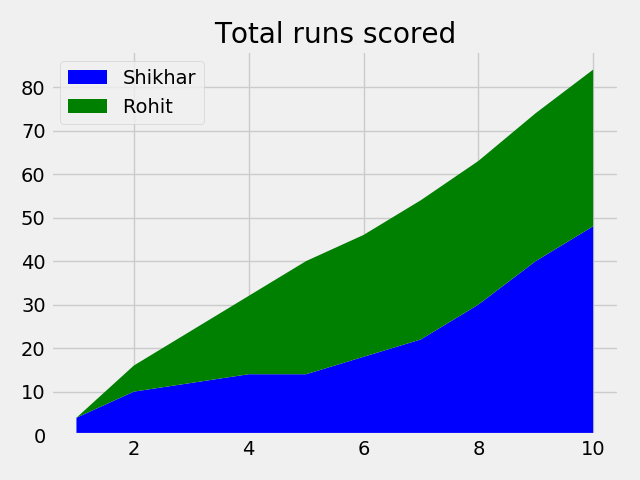
We can customize the Matplotlib Stack Plot by adding labels, colors etc.

To add the labels, we will create a list of labels and pass it to plt.stackplot() and then call the plt.legend() method.

# matplotlib_stack_bar.py

import matplotlib.pyplot as plt

plt.style.use('fivethirtyeight')

overs = [1, 2, 3, 4, 5, 6, 7, 8, 9, 10]
batsman1 = [4, 10, 12, 14, 14, 18, 22, 30, 40, 48]
batsman2 = [0, 6, 12, 18, 26, 28, 32, 33, 34, 36]

labels = ['Shikhar', 'Rohit']
plt.stackplot(overs, batsman1, batsman2, labels=labels)
plt.legend()
plt.title('Total runs scored')
plt.tight_layout()
plt.show()

matplotlib_tutorial_stackplot_.png

Here, the legends are overlapping the plot, you can pass loc to plt.legend() to hard-code the location of the legends. And you can add colors by passing a list of colors to the plt.stackplot().

colors = ['blue', 'green']
plt.stackplot(overs, batsman1, batsman2, labels=labels, colors=colors)
plt.legend(loc = 'upper left')

You can either add numerical coordinates or the following values to loc:-

    best
    upper right
    upper left
    lower left
    lower right
    right
    center left
    center right
    lower center
    upper center
    center

matplotlib_tutorial_stackplot__.png

Video Tutorial

Table of Contents of Matplotlib Tutorial in Python

Matplotlib Tutorial in Python | Chapter 1 | Introduction

Matplotlib Tutorial in Python | Chapter 2 | Extracting Data from CSVs and plotting Bar Charts

Pie Charts in Python | Matplotlib Tutorial in Python | Chapter 3

Matplotlib Stack Plots/Bars | Matplotlib Tutorial in Python | Chapter 4

Filling Area on Line Plots | Matplotlib Tutorial in Python | Chapter 5

Python Histograms | Matplotlib Tutorial in Python | Chapter 6

Scatter Plotting in Python | Matplotlib Tutorial | Chapter 7

Plot Time Series in Python | Matplotlib Tutorial | Chapter 8

Python Realtime Plotting | Matplotlib Tutorial | Chapter 9

Matplotlib Subplot in Python | Matplotlib Tutorial | Chapter 10

Python Candlestick Chart | Matplotlib Tutorial | Chapter 11

If you have liked our tutorial, there are various ways to support us, the easiest is to share this post. You can also follow us on facebook, twitter and youtube.

In case of any query, you can leave the comment below.

If you want to support our work. You can do it using Patreon.

In the next chapter we will learn about Filing Area on Line Plots in Matplotlib.


Related Posts

Python Tutorial for Beginners
By Udit Vashisht

Python Tutorial for Beginners

Have you heard a lot about Python Language? Are you looking for free and reliable resource to learn Python? If Yes, your search for the Best Python Tutorial is over.

We are excited to bring an exhaustive Python tutorial for a complete beginner. Even ...

Read More
Python Realtime Plotting | Matplotlib Tutorial | Chapter 9
By Udit Vashisht

Python Realtime Plotting in Matplotlib

Python Realtime Plotting | Chapter 9

In this tutorial, we will learn to plot live data in python using matplotlib. In the beginning, we will be plotting realtime data from a local script and later on we will create a python live plot ...

Read More
Scatter Plotting in Python | Matplotlib Tutorial | Chapter 7
By Udit Vashisht

Scatter Plot in Python using Pandas and Matplotlib

In this tutorial we will learn to create a Scatter Plot in Python using Matplotlib and Pandas. We will use matplotlib.pyplot()’s plt.scatter() to create the scatter plot

What is a Scatter Plot?

Scatter Plot also known as scatter plots ...

Read More
Search
Tags
tech tutorials automate python beautifulsoup web scrapping webscrapping bs4 Strip Python3 programming Pythonanywhere free Online Hosting hindi til github today i learned Windows Installations Installation Learn Python in Hindi Python Tutorials Beginners macos installation guide linux SaralGyaan Saral Gyaan json in python JSON to CSV Convert json to csv python in hindi convert json csv in python remove background python mini projects background removal remove.bg tweepy Django Django tutorials Django for beginners Django Free tutorials Proxy Models User Models AbstractUser UserModel convert json to csv python json to csv python Variables Python cheats Quick tips == and is f string in python f-strings pep-498 formatting in python python f string smtplib python send email with attachment python send email automated emails python python send email gmail automated email sending passwords secrets environment variables if name == main Matplotlib tutorial Matplotlib lists pandas Scatter Plot Time Series Data Live plots Matplotlib Subplots Matplotlib Candlesticks plots Tutorial Logging unittest testing python test Object Oriented Programming Python OOP Database Database Migration Python 3.8 Walrus Operator Data Analysis Pandas Dataframe Pandas Series Dataframe index pandas index python pandas tutorial python pandas python pandas dataframe python f-strings padding how to flatten a nested json nested json to csv json to csv python pandas Pandas Tutorial insert rows pandas pandas append list line charts line plots in python Django proxy user model django custom user model django user model matplotlib marker size pytplot legends scatter plot python pandas python virtual environment virtualenv venv python python venv virtual environment in python python decorators bioinformatics fastafiles Fasta python list append append raspberry pi editor cron crontab Cowin Cowin api python dictionary Python basics dictionary python list list ios development listview navigationview swiftui ios mvvm swift environmentobject property wrapper @State @Environm popup @State ios15 alert automation instagram instaloader texteditor youtubeshorts textfield multi-line star rating reusable swift selenium selenium driver requests-html youtube youtube shorts python automation python tutorial algo trading nifty 50 nifty50 stock list nifty50 telegram telegram bot dictionary in Python how to learn python learn python